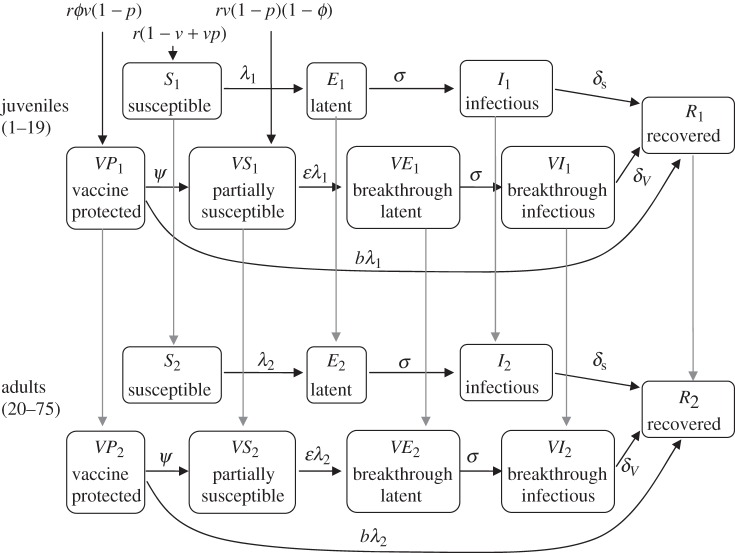
Figure 1.
Flowchart of chickenpox epidemiological model. For the simplicity of the flowchart, we did not draw death terms into the chart, ks,1,ks,2, kv,1 and kv,2 indicating juvenile death rate from varicella with no vaccine, adult death rate from varicella with no vaccine, varicella mortality of vaccinated juveniles and varicella mortality of vaccinated adults, respectively.

