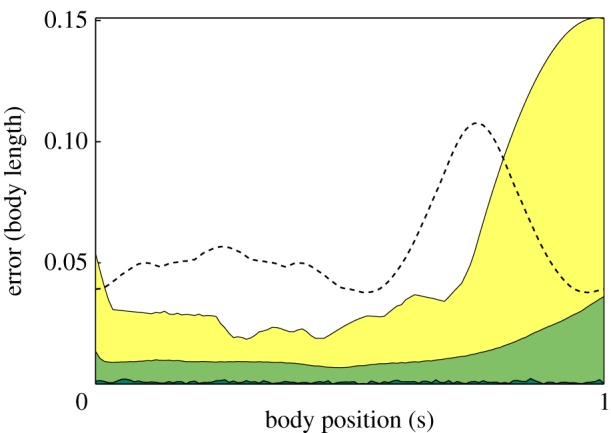
Figure 7.

Error for midline fit. The midline was manually selected on a random set of 100 top-view frames. The distance was computed between the projected estimate and the manually generated midline was measured in the top camera frame. Dark green, minimum; light green, mean; yellow, maximum. For comparison with previous work, we also computed the mean error (dashed line) for a fish shape modelled as a bent ellispoid [21]. (Online version in colour.)
