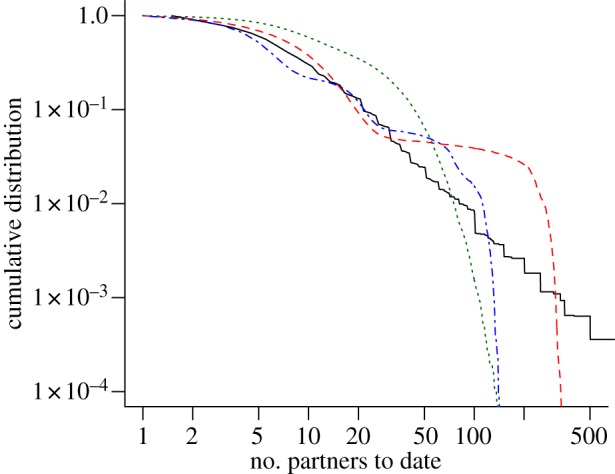
Figure 2.

Cumulative distribution of the lifetime number of heterosexual partners to date. Data from Natsal 2000 exhibit a scale-free distribution (black solid line). Assortative mixing between risk groups in the Kretzschmar model (red dashed line) and the ClaSS model (blue dashed-dotted line) can approximate this property to a certain extent. More random mixing in the Turner model results in a Poisson-like degree distribution (green dotted line). The graph represents data from all women and men aged 16–44 years. (Online version in colour.)
