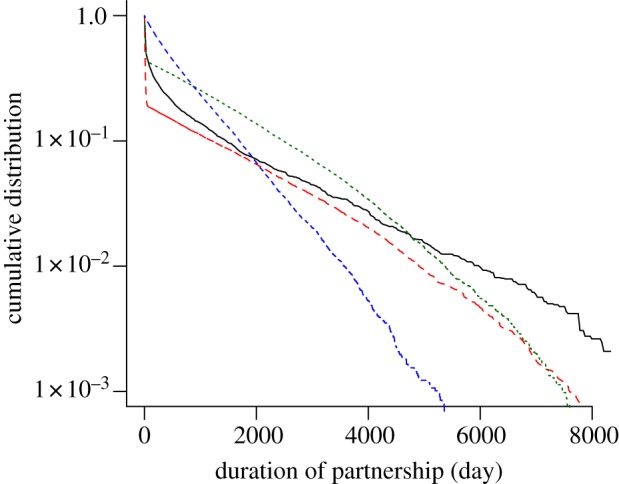
Figure 4.

Cumulative distribution of the sexual partnership duration. The survival curve of partnerships from Natsal 2000 shows a large proportion of short partnerships and exhibits a long tail for longer partnerships (black solid line). Individual-based models generally assume exponential distributions of partnership duration and only mimic the empirical data if they explicitly account for short (casual) partnerships, such as the Kretzschmar model (red dashed line) and the Turner model (green dotted line). The blue dashed-dotted line denotes the ClaSS model. The graph represents data from the second most recent heterosexual partnership of all women and men aged 16–44 years. (Online version in colour.)
