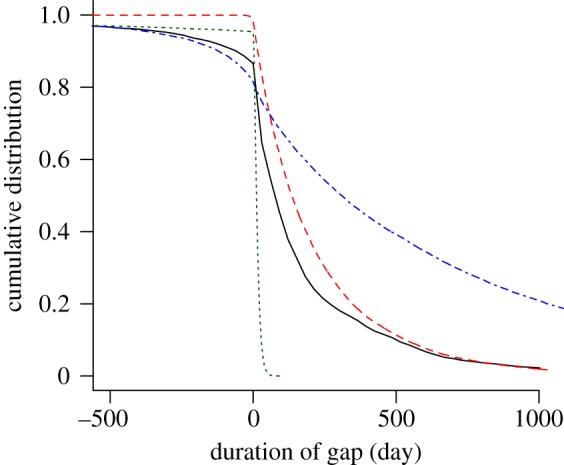
Figure 5.

Cumulative distribution of the gap length. Negative gaps denote overlaps between partnerships and positive gaps denote waiting times until new partnerships are formed. Owing to different assumptions of the partnership formation process, individual-based models exhibit different gaps and overlaps. The graph represents data about gaps or overlaps between the most recent and the second most recent heterosexual partnership from all women and men aged 16–44 years. The black solid line denotes Natsal 2000; the red dashed line denotes the Kretzschmar model; the green dotted line denotes the Turner model and the blue dashed-dotted line denotes the ClaSS model. (Online version in colour.)
