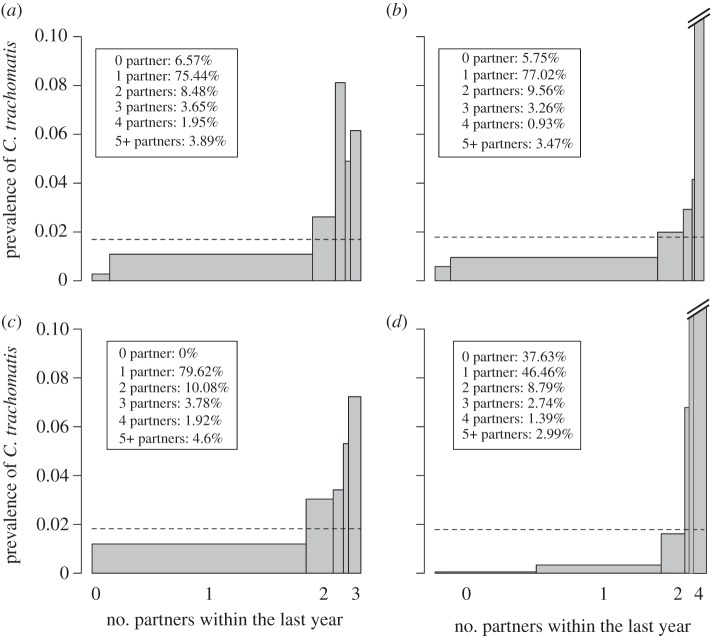
Figure 6.
Asymmetric distribution of C. trachomatis infections among individuals with different levels of sexual activity. The width of each bar represents the proportion of people that have had a given number of sexual partners within the last year (the legend shows the distribution of sexual partner numbers). The height of the bar indicates the prevalence of C. trachomatis in each group. Note that the prevalence in the group with highest activity (five or more partners) is 20% in the Kretzschmar model and 34% in the ClaSS model. Overall prevalence is given by the dashed line and is approximately the same in all graphs (1.7%). Data are given for women and men aged 18–44 years. (a) Natsal 2000; (b) Kretzschmar model; (c) Turner model and (d) ClaSS model.

