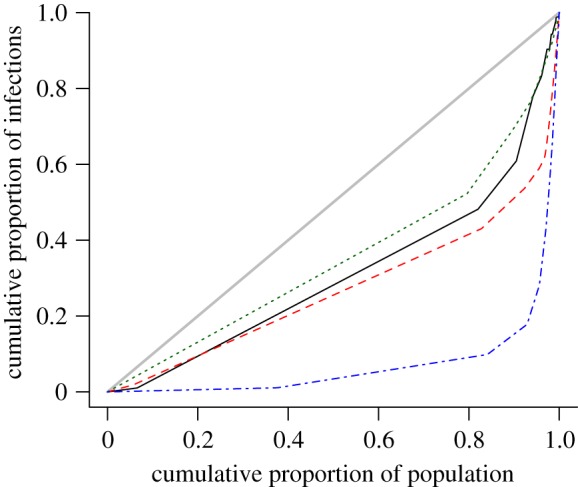
Figure 7.

Lorenz curve representing the cumulative proportion of C. trachomatis infections as a function of the cumulative proportion of the population, after population sub-groups have been ranked in the order of their sexual activity during the last year. Natsal 2000 (G = 0.38), Kretzschmar model (G = 0.46 (mean) ± 0.03 (SD)), Turner model (G = 0.32 ± 0.04), ClaSS model (G = 0.84 ± 0.02). The line y = x denotes perfect equality, i.e. an equal dispersion of the infection within the population (thick gray line). The Lorenz curves represent data from all women and men aged 18–44 years. The black solid line denotes Natsal 2000; the red dashed line denotes the Kretzschmar model; the green dotted line denotes the Turner model and the blue dashed-dotted line denotes the ClaSS model. (Online version in colour.)
