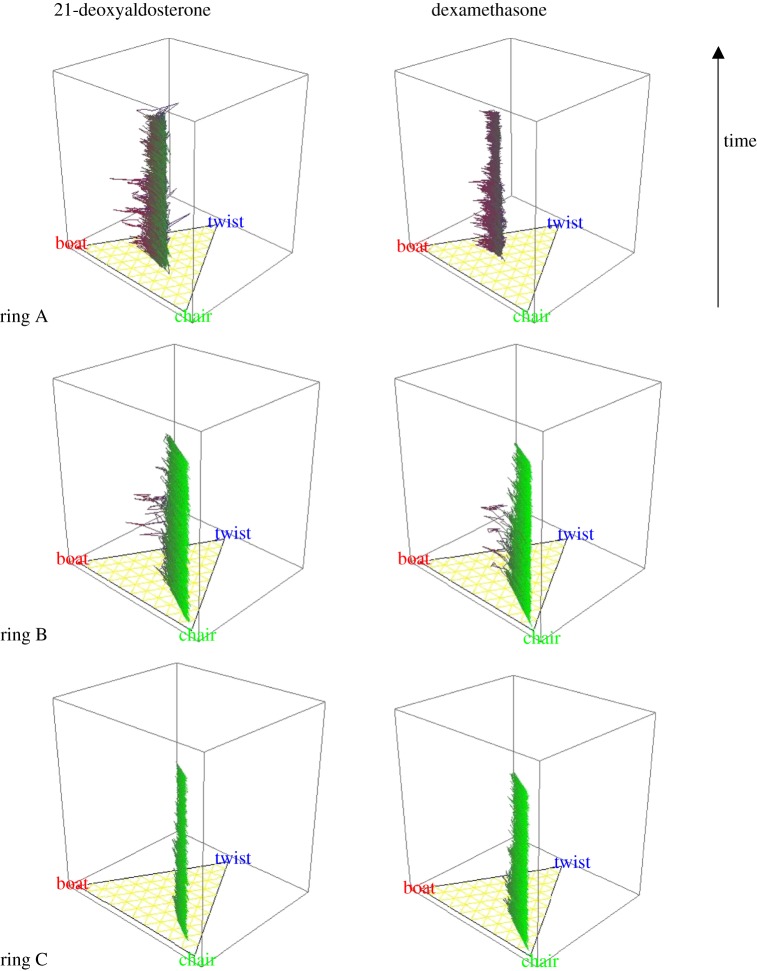
Figure 1.
The MD trajectory is depicted in ternary diagrams to show the changes in geometry for each six-membered ring (independently A, B and C). Here, the plots show a line drawn between configurations of the ring that are coloured according to green for chair-like, blue for twist-like, and red for boat-like. The vertical axis is time, giving a trajectory between the points in configurational space. The examples given here are for (upper figure) 21-deoxyaldosterone and (lower figure) dexamethasone, potent mineralocorticoid and glucocorticoid, respectively. See the electronic supplementary material, tables S1 and S2, figures S1 and S2 and movies (a), (b) and (c) for steroid activities, structures and exemplary steroid mobility simulations.

