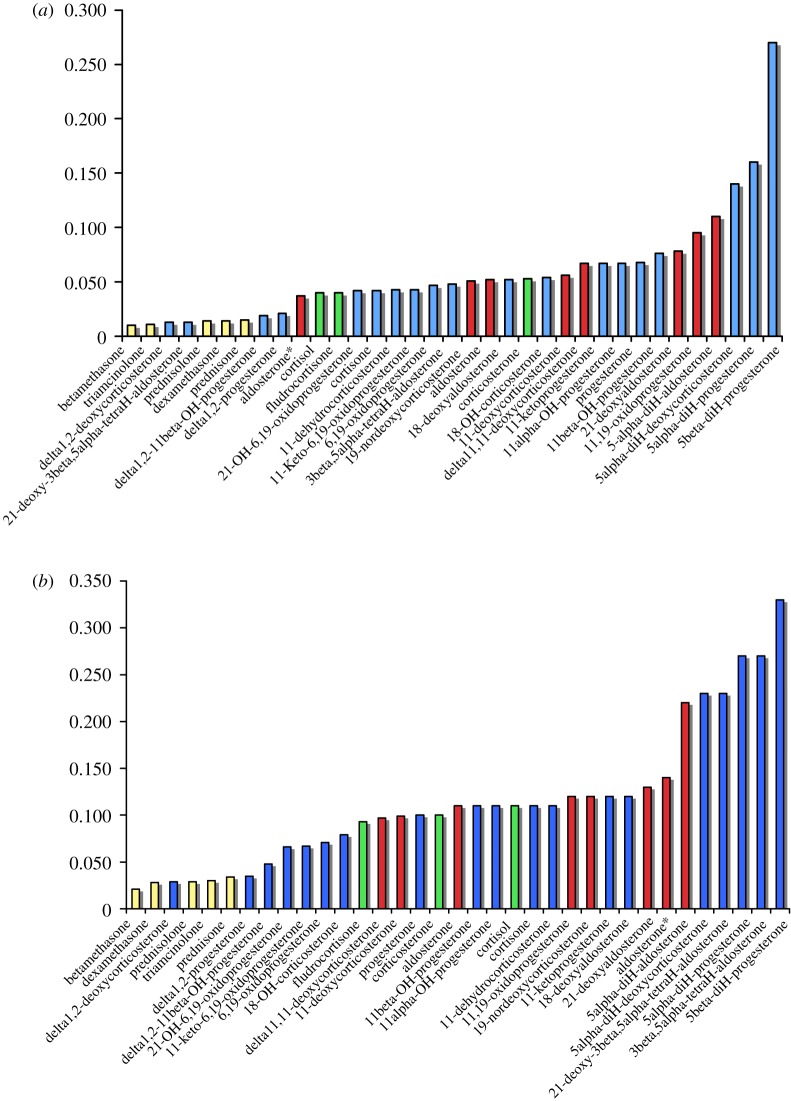
Figure 2.
Ring A flexibility (y-axis), CP measures the convex polygon of the points within the three-dimensional-ternary diagram of conformational space. Exemplary glucocorticoids are shown in yellow, and mineralocorticoids in red. Examples of compounds that may show either function are shown in green and inactive or low activity compounds are shown in blue. (a) Simulations at 300 K, (b) at 600 K (sets 1 and 2, respectively). See the electronic supplementary material, tables S1 and S2, figures S1 and S2 and movies (a), (b) and (c) for steroid activities, structures and exemplary steroid mobility simulations. *Aldosterone full acetal (see supplementary material).

