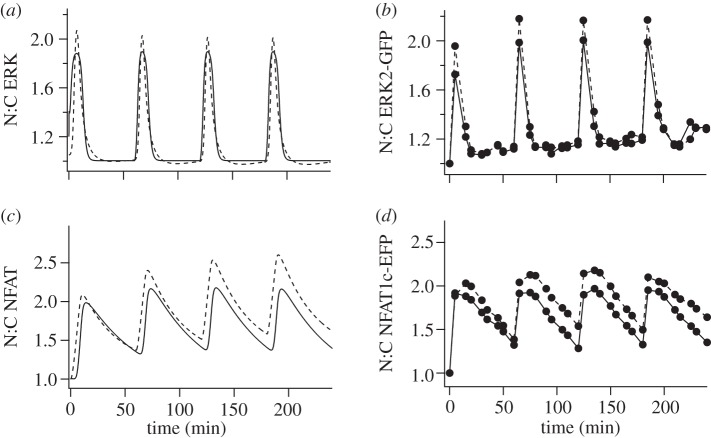
Figure 2.
Modelling the effects of GnRH pulses on nuclear translocation of ERK and NFAT. (a,c) Data from simulations in which cells are stimulated with 5 min pulses of 10−9 M (solid line) or 10−7 M (dashed line) GnRH at 1 h intervals. The predicted effects on N:C ERK or N:C NFAT are shown as fold change over the normalized values at t = 0. (b,d) Corresponding experimental data obtained by live cell imaging in HeLa cells transduced to express GnRHR and either NFAT1c-EFP or ERK2-GFP. See [23,24] for detailed methods.

