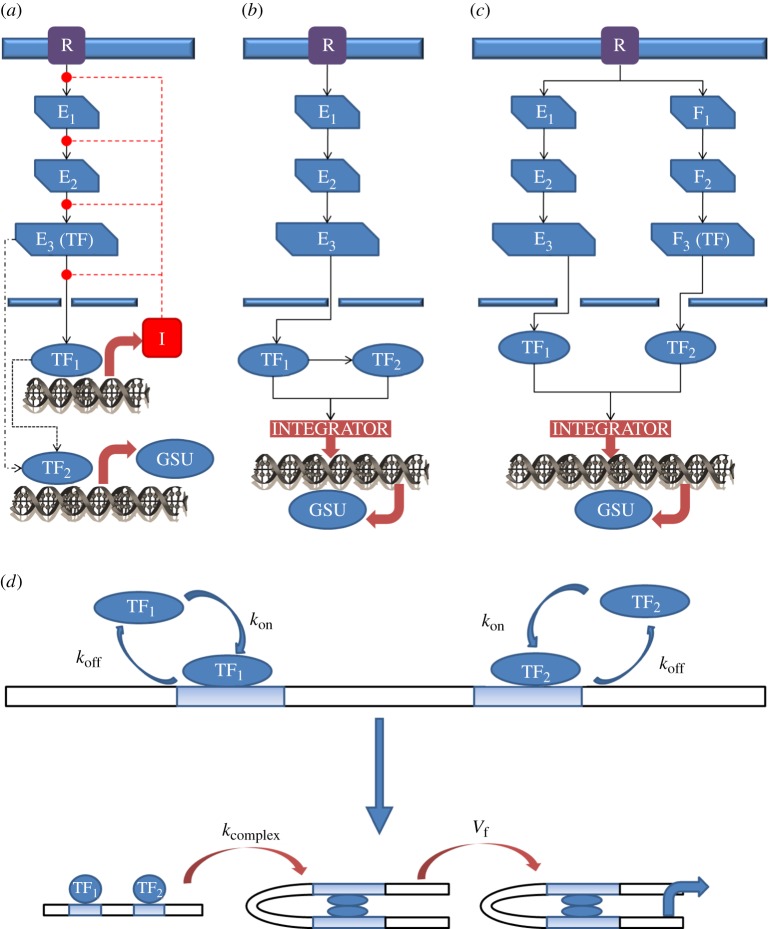
Figure 4.
Schematic of the GnRH signalling cascade. R denotes GnRHR, Ei and Fi, i = 1, 2, 3, stand for effector proteins, I represents an inhibitor, and TF1 and TF2 are the transcription factors we model. (a) An example of a GSU regulatory network comprising multiple signalling pathways including feed-forward and/or negative feedback loops. (b) Schematic of the sequential activation network topology. (c) Schematic of parallel activation network topology. (d) In the CO-OPERATIVE GATE scenario, the transcription factors bind at independent promoter sites. After initial binding of the transcription factors to DNA the transcription factors interact to bring promoter sites in close proximity. (Online version in colour.)

