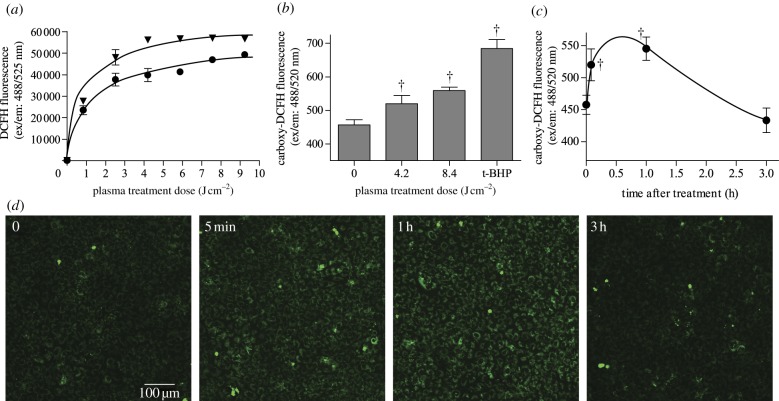
Figure 2.
ROS were produced by DBD plasma in liquid and cells. (a) Cumulative extracellular ROS in PBS (circles) and serum-free (inverted triangles) medium detected using DCFH (ex/em: 488/525 nm). p < 0.001 compared with control for both PBS and serum-free medium, and p < 0.0001 between PBS and serum-free medium. (b) Intracellular ROS were measured using carboxy-H2DCFDA (ex/em: 488/520 nm). PAEC were incubated with carboxy-H2DCFDA for 30 min at 37°C and then treated with plasma or positive control tert-butyl hydroperoxide (100 µM, tBHP). (c) Intracellular ROS levels for 3 h following DBD plasma treatment. (d) Sample ROS images taken by confocal microscopy and quantified using ImageJ. †p < 0.001 compared with untreated control. (Online version in colour.)

