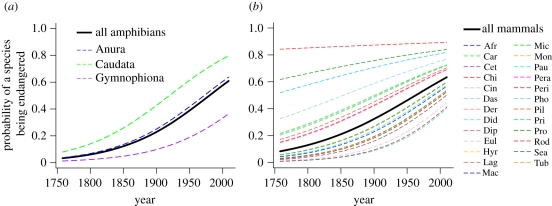
Figure 4.
Best-fit GLMMs demonstrating that extinction proneness increases with the year of description for both amphibians (a) and land mammals (b) (see table 2 for multimodel inference statistics). Black lines represent population level fitted values. The fitted relationship between year of description and proportion of species threatened within each phylogenetic (order) group are represented by colored, dotted lines. Mammal order abbreviations—Afr: Afroscoricida, Car: Carnivora, Cet: Cetartiodactyla, Chr: Chiroptera, Cin: Cingulata, Das: Dasyuromorphia, Der: Dermoptera, Did: Didelphimorphia, Dip: Diprotodontia, Eul: Eulipotyphla, Hyr: Hyracoidea, Lag: Lagomorpha, Mac: Macroscelidea, Mic: Microbiotheria, Mon: Monotremata, Pau: Paucituberculata, Pera: Peramelemorphia, Per: Perissodactyla, Pho: Pholidota, Pil: Pilosa, Pri: Primates, Pro: Proboscidea, Rod: Rodentia, Sca: Scandentia, Tub: Tubulidentata.

