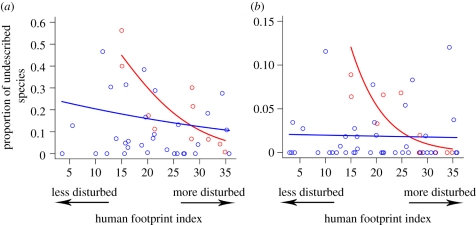
Figure 5.
Best-fit GLMMs demonstrating the correlation between proportion of undescribed species and human footprint and biome type (see table 3 for multimodel inference statistics). Tropical forests with minimal anthropogenic disturbance are likely to contain the highest proportion of undescribed species. Red dots represent tropical forest realm-biomes while blue dots represent other realm-biomes. Red lines illustrate the relationship between human footprint index and proportion of newly described species in tropical forests while blue lines illustrate the same relationship in other biomes.

