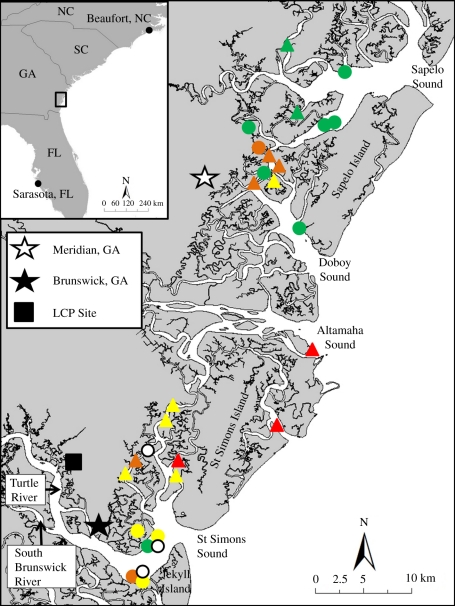
Figure 1.
Map of area with dolphin capture locations and PCB concentration (µg g−1 lipid weight) measured in blubber. Circles represent females, triangles represent males. Dolphins sampled in Altamaha Sound and north were categorized as ‘Sapelo’; dolphins sampled south of the Altamaha were categorized as ‘Brunswick’. PCB µg g−1, white symbols, no data; green symbols, 0–100; yellow symbols, 101–200; orange symbols, 201–300; red symbols, >301.

