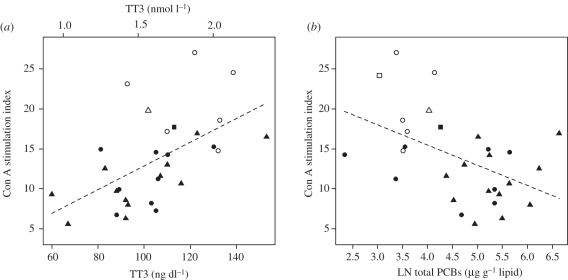
Figure 4.
Results from linear model (ANCOVA) examining association of T-lymphocyte stimulation index with (a) TT3 and (b) natural logarithm (LN) of total PCBs measured in blubber. The model included all males as well as calf and juvenile females sampled near Brunswick, GA, Sapelo Island, GA, Sarasota, FL and Beaufort, NC. Age class and site were included as covariate terms. Circles, squares and triangles represent calves, juveniles and adults, respectively. Solid filled symbols represent samples from the Georgia sites (Sapelo and Brunswick), and hollow symbols represent samples from the reference site (Beaufort).

