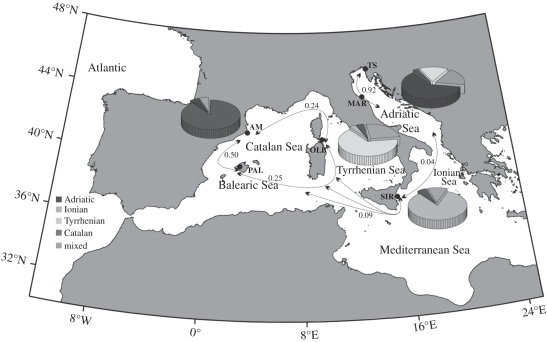
Figure 4.
Distribution of different populations of Alexandrium minutum and indirect connectivity estimated from different sampling sites in the Mediterranean Sea. The pie graph for each site shows the percentage of individuals, typed at seven microsatellites, assigned to one of the four clusters identified by PCoA and the Bayesian method (see also electronic supplementary material, table S7).

