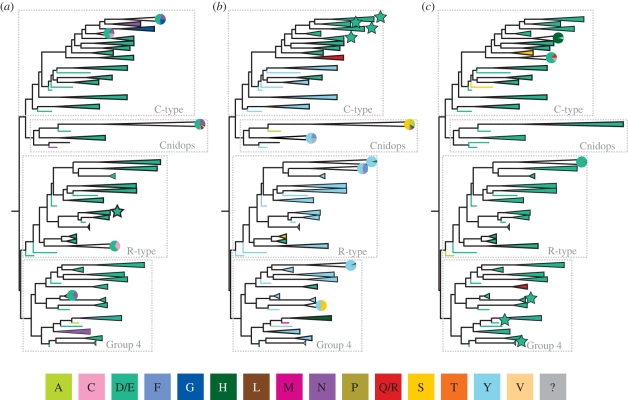
Figure 6.
Maximum-likelihood phylogeny as in figure 2, with the four major lineages indicated. Each well-supported clade has been coloured based on the residue present at three potential counterion sites: (a) bovine rhodopsin site 83, (b) bovine rhodopsin site 113, and (c) bovine rhodopsin site 181. For each group, if more than one amino acid with significantly different properties is found at a particular site, a pie chart representing the proportion of each residue within the group is included. Groups where the counterion position has been demonstrated using biochemical techniques are indicated with a star. The colours used to indicate amino acids are in the figure key; polarity of the reconstructed amino acids is as follows: non polar: A, F, L, M, P, V; no charge: C, G, N, Q, R, S, T, Y; negative: D, E; positive: H, Q, R. Amino acid residues unknown owing to unavailable data are indicated by a ‘?’ and are coloured grey in the figure.

