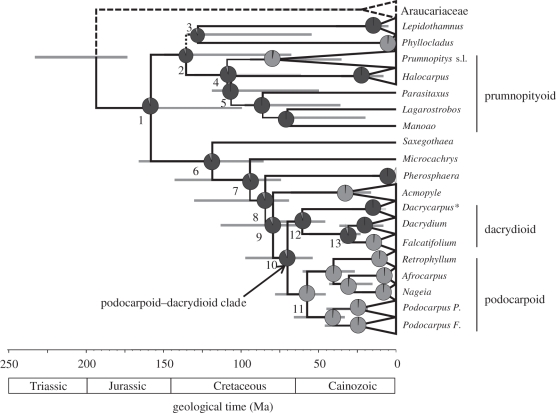
Figure 2.
Phylogeny of Podocarpaceae (generic-level sampling, refer the electronic supplementary material, figure S2 for full sample) derived using Bayesian-relaxed clock analysis of plastid DNA sequences. Branches are proportional to time, and horizontal grey bars represent the 95% HPD of divergence times for the associated node. All branches have a PP = 1.0, unless indicated adjacent to the branch. Pie charts represent posterior probabilities of reconstructed ancestral states for leaf morphology using Bayesian optimization criteria (dark grey, IL; light grey, FF). Numbers adjacent to nodes and highlighted taxon groups are referred to in the text and/or electronic supplementary material, table S6. Most Dacrycarpus (asterisked) are polymorphic for leaf morphology.

