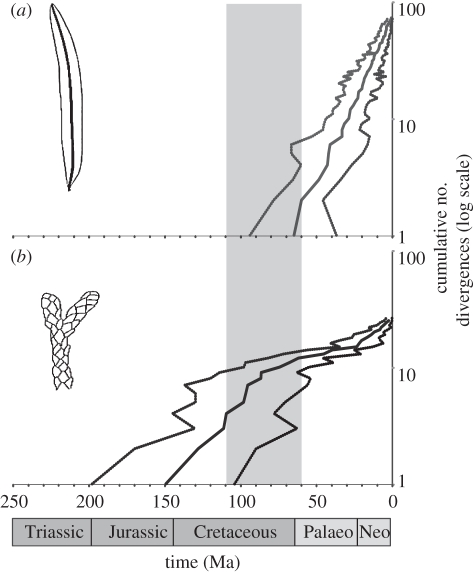
Figure 3.
Cumulative number of podocarp lineages (log scale) through time partitioned by leaf morphology (a) FF; (b) IL based upon ancestral state reconstructions for Podocarpaceae (most probably state at each node). In each instance, the solid line represents the mean node height and the dashed lines, the upper and lower limits of the 95% HPD of divergence times for the maximum clade credibility tree inferred from the Bayesian-relaxed clock analyses. The grey bar represents the approximate timing of the rise of fossil angiosperm leaf vein densities to the levels comparable with Modern tropical rainforest species (modified from [19]).

