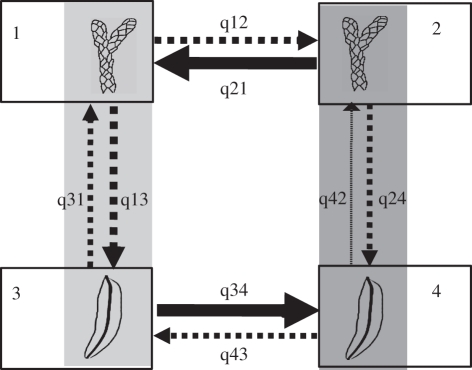
Figure 4.
Flow diagram showing the eight possible transitions (qij) between binary traits for leaf morphology and climatic range (1, imbricate leaves, microthermal; 2, imbricate leaves, meso-megathermal; 3, flattened foliage, microthermal; 4, flattened foliage, meso-megathermal). The direction of the arrow indicates the direction of change in a trait, and arrow thickness is commensurate to the mean rate estimate from the posterior sample. Transitions for which a zero rate is rejected are indicated by the solid arrows, while for dashed arrows, a non-zero rate has a posterior probability of less than 0.75 (refer to the electronic supplementary material, figure S4).

