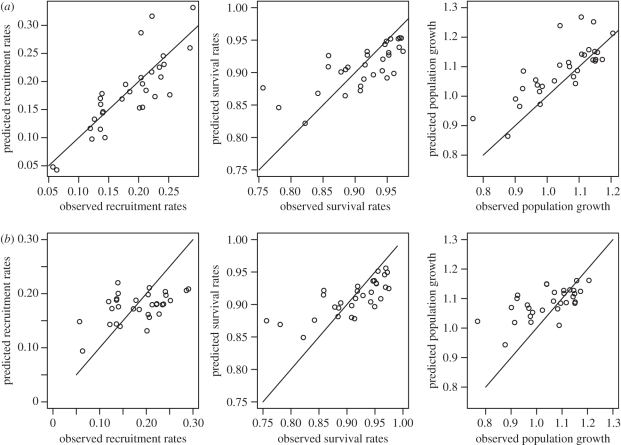
Figure 2.
Associations between predicted and observed recruitment rates, survival rates and population growth for models using annual fluctuation in (st)age structure (a) and models for which the (st)age structure was fixed at the average observed during the study (b). Adjusted r2 for models with and without yearly variation in (st)age structure are presented in table 1. The solid lines represent the theoretical association between predicted and observed rates if the adjusted r2 were 1.

