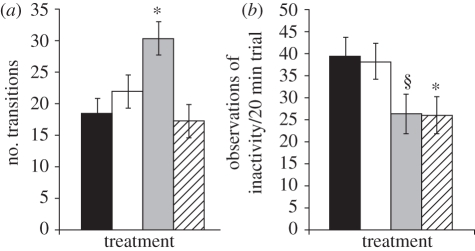
Figure 2.
Differences in activity level in round 1 as a function of developmental immune treatment. (a) Number of transitions between sections; (b) incidence of inactivity. Shown are mean with SEM error bars for CONTROL (black bars), EARLY (open bars), MIDDLE (grey bars) and LATE (hatched bars) birds (see text for definitions of treatment groups). Least-squares mean comparisons revealed that MIDDLE birds made significantly more transitions between room sections in consecutive 20 s scans compared to CONTROL birds, and LATE birds were inactive less frequently than CONTROL birds (*p < 0.05). MIDDLE birds also tended to be inactive less frequently than CONTROL birds (§0.05 < p < 0.06).

