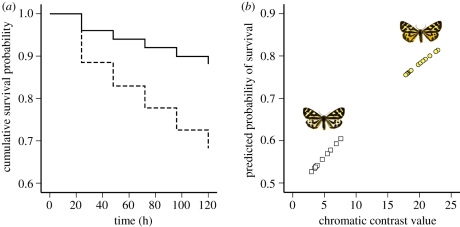
Figure 2.
(a) Survival plot of the yellow (solid line) and white (dashed line) colour morph survival in the field. The lines are the probability of surviving avian predation as a function of time (hours) based on Cox regression estimates to account for censored data during the 5 day experiment. (b) Chromatic contrast values of hind wing colour compared against different backgrounds and their relation to predicted probability of survival. Squares represent white males and circles represent yellow males.

