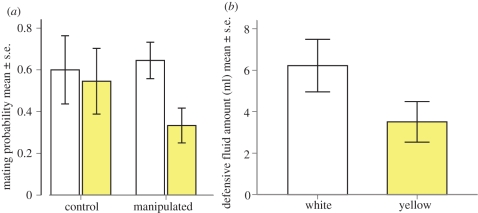
Figure 3.
(a) The mean mating probability of wood tiger moth males. On the x-axis, the ‘control’ represents individuals, which were not in the defensive fluid treatment, and ‘manipulated’, stands for the defensive fluid (i.e. droplet) treatment group. Left bars within the group (white) stands for the white males, and right bars (yellow) represent yellow males. On the y-axis is the mating probability of males, when females have no alternative choice. (b) The mean volume (mm3) of defensive fluid between two male colour morphs of wood tiger moth.

