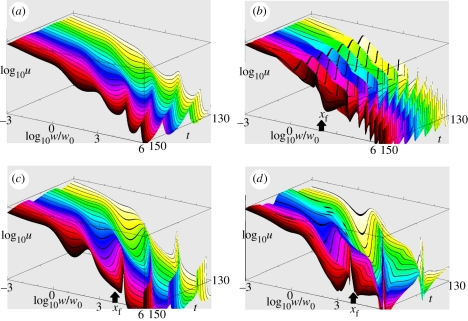
Figure 1.
Examples of simulated size spectra (parameters from table 1) over years 130 to 150. (a) No fishing; (b) selectively fishing small fish (s = 4, log10(wf/w0) = 2, C0 = 0.01); (c) non-selectively targeting large fish (s = 0.25, log10(wf/w0) = 4, C0 = 0.01); and (d) selectively fishing large fish (s = 4, log10(wf/w0) = 4, C0 = 0.01). Colours vary from yellow to black from year 130 to year 150. Arrows show the size targeted by fishing.

