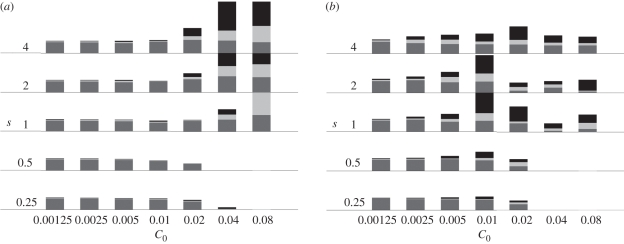
Figure 3.
Summary of biomass variations as a function of fishing selectivity and intensity when target size is (a) log10(wf/w0) = 2 or (b) log10(wf/w0) = 4. The x-axis spans fishing intensity measured by expected catch C0 that is, the catch that would be produced by applying the fishing effort to the unfished spectrum (C0 is used to calculate the fishing mortality multiplier a). The y-axis spans fishing selectivity s. Each bar shows: minimum (dark grey), median (light grey), and maximum (black) biomass (over simulated years 130–150). Median biomass ≈0.07 g m−3 for C0 = 0.00125. Empty cells correspond to total extinction of biomass in the system.

