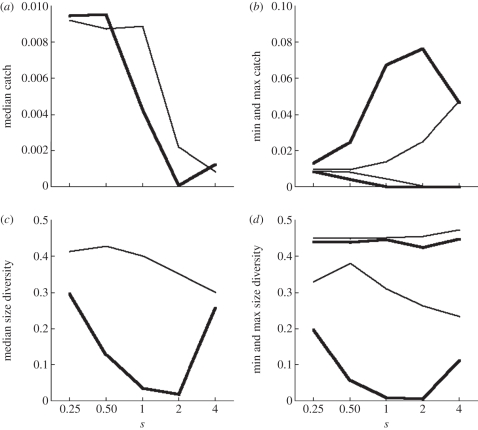
Figure 4.
Community metrics as a function of fishing selectivity when targeting small (log10(wf/w0) = 2, thin lines) or large (log10(wf/w0) = 4, bold lines) fish with moderate fishing intensity (C0 = 0.01), over years 130 to 150. (a) Median catch, (b) minimum and maximum catch, (c) median size diversity, and (d) minimum and maximum size diversity.

