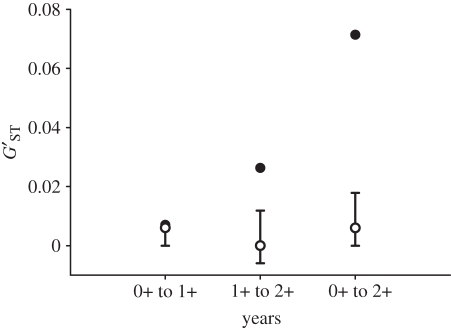
Figure 2.
MHC and microsatellite population genetic differentiation exhibited across 3 years of study in Atlantic salmon (Salmo salar) offspring in the Ste-Marguerite River in Québec, Canada. Closed circles indicate pairwise estimates of population differentiation ( ) between the years for the MHC class II. Population genetic differentiation at microsatellite loci is indicated by open circles and the error bars indicate 95% CI surrounding the estimate of differentiation.

