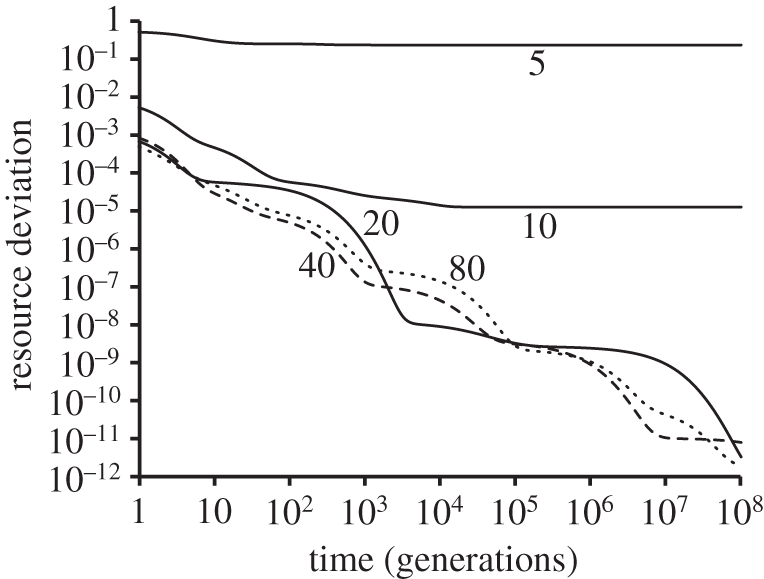
Figure 4.

Increased resource utilization efficiency through time for the five simulations shown in figure 2. The y-axis measures the integral of the squared deviation between available resource and the threshold efficiency (di/bi) at every point on the gradient. Note that time is depicted on a logarithmic axis. Numbers correspond to the initial number of species present in each simulation.
