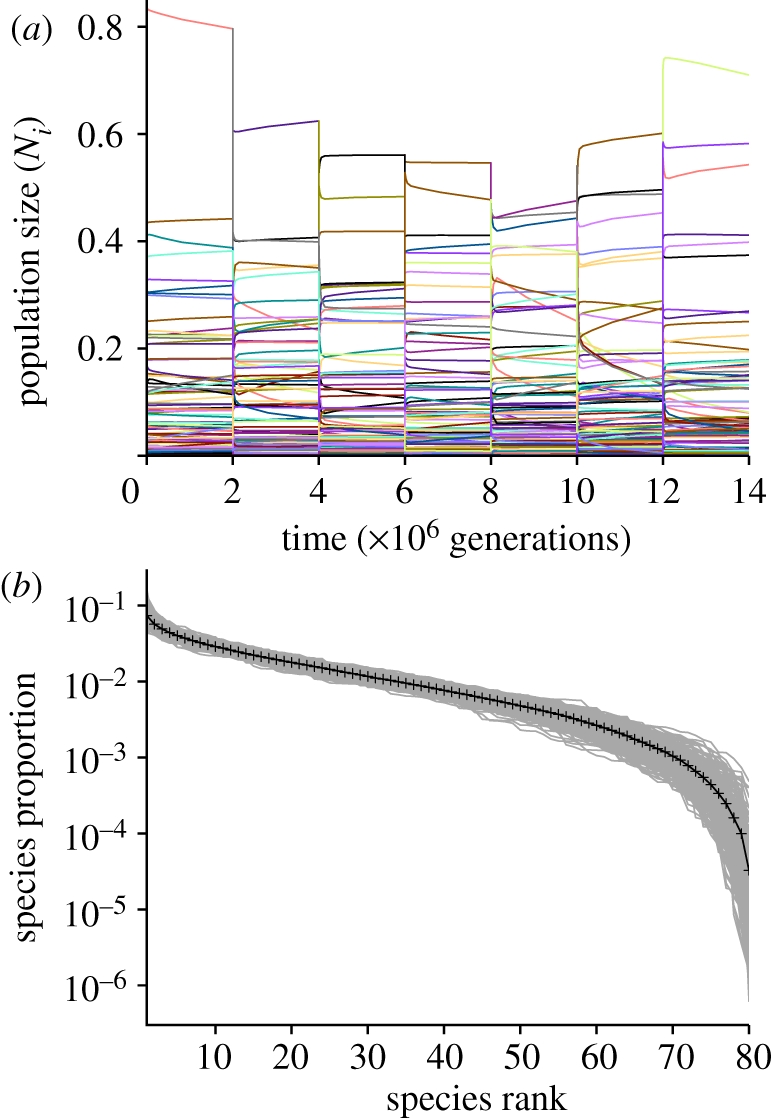
Figure 5.

The effect of perturbations on accommodated community states. (a) Seven of 300 perturbations imposed every 2 × 10⁶ generations for 600 × 106 generations. Colours correspond to different species; note that species do not return to pre-perturbation population sizes after each disruption event. Time on the x-axis is linear, unlike figure 2. (b) Average rank abundance distribution after 2 × 10⁶ generations. Black line is mean value of overlapping grey lines corresponding to each accommodated interval. The simulation uses 80 species with niche widths distributed randomly and uniformly between 0.10 and 0.20 (mean niche width = 0.15). The first 10 intervals were discarded because their abundance distributions remained correlated to the initial population size values.
