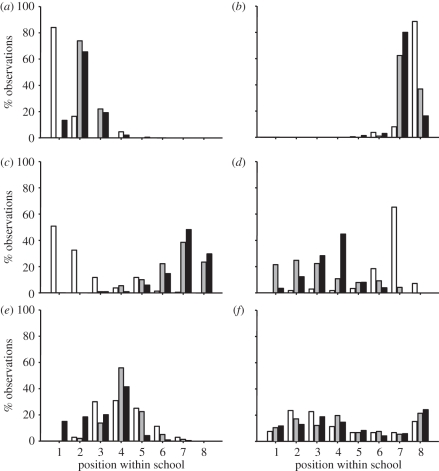
Figure 3.
Example frequency distributions of observations at each position within schools of juvenile golden grey mullet swimming at 10 cm s−1(white bars), 20 cm s−1(grey bars) or 30 cm s−1 (black bars). Position 1 = front of school, 8 = rear of school. (a) A fish with preference for anterior positioning (fish 1); (b) a fish with preference for posterior positioning (fish 14); (c) a fish that moved to more posterior positions as speed increased (fish 15); (d) a fish that moved to more anterior positions as speed increased (fish 9); (e) a fish displaying a moderate amount of variation around a central mean at each speed (fish 17); (f) a fish displaying a large amount of variation around central means at each speed (fish 20).

