
Figure 5.
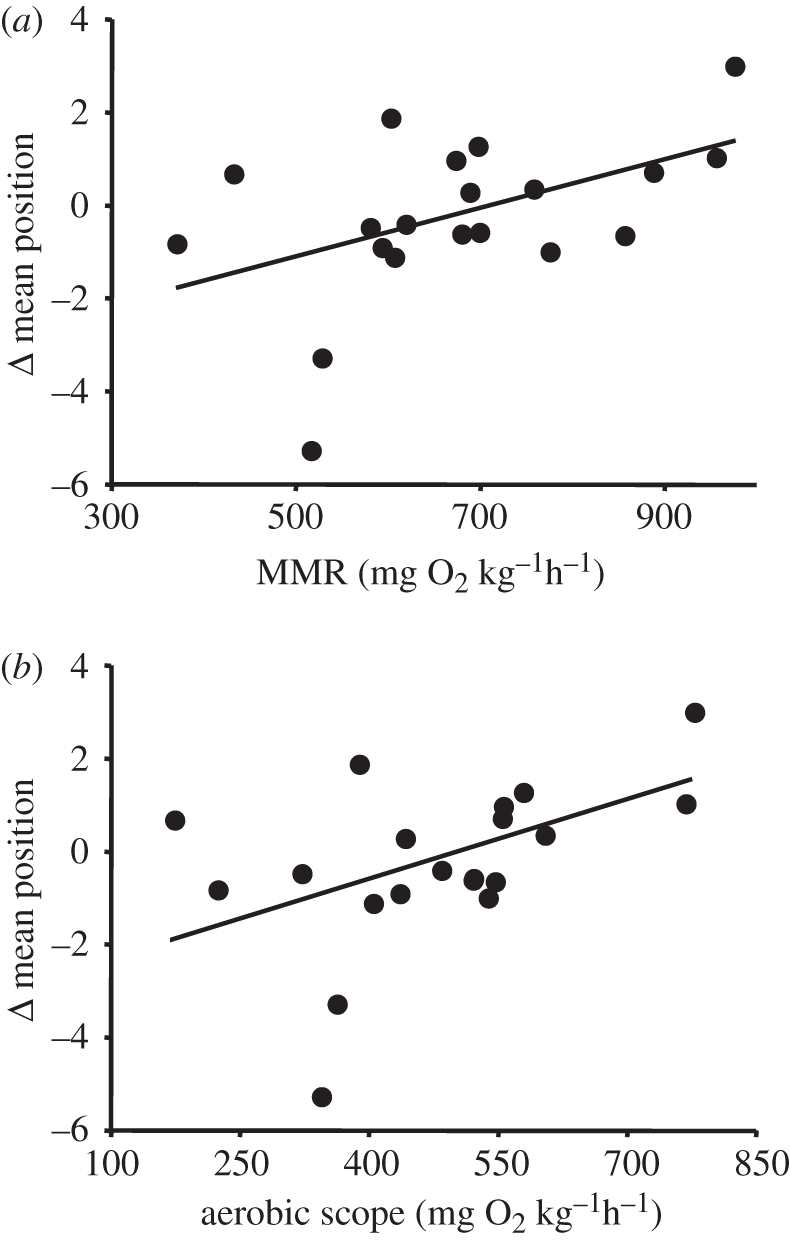
Relationship between the change in mean position within schools between 10 and 30 cm−1 and (a) maximal metabolic rate (MMR) and (b) aerobic scope (AS). Each point represents data for a focal fish within a given school (n = 20). Positive y-axis values indicate anterior movement as speed increased. Regression equations are as follows: (a) Δ mean position = –3.82 + 0.005(MMR), r2 = 0.24, p = 0.029; Δ mean position = –2.76 + 0.005(AS), r2 = 0.22, p = 0.037.