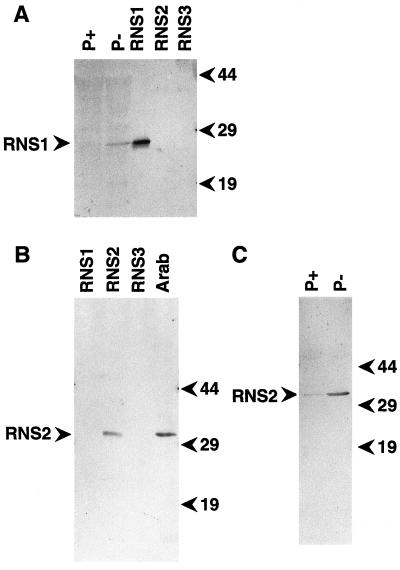
Figure 1.
Immunoblot characterization of anti-RNS1 and anti-RNS2 antibodies and RNS1 and RNS2 regulation in response to Pi starvation. Protein samples were resolved by SDS-PAGE, transferred to a membrane, and immunodetected with the corresponding antiserum. A, Immunoblot with lanes containing approximately 70 ng of RNS1, RNS2, or RNS3 in supernatant from RNase-expressing yeast cells as indicated or 30 μg of total proteins from Arabidopsis seedlings grown on media rich (P+) or deficient (P−) in Pi. The blot was developed using anti-RNS1 antibodies. B, Immunoblot with lanes containing approximately 300 ng of RNS1, RNS2, or RNS3, as indicated, from supernatant from RNase-expressing yeast cells. Arab, Lane containing 50 μg of proteins extracted from aboveground tissues of 5-week-old wild-type Arabidopsis plants. The blot was developed using anti-RNS2 antibodies. C, Increase in RNS2 abundance during Pi starvation. Lanes contain 25 μg of protein extracts from seedlings grown on media rich (P+) or deficient (P−) in Pi. The blot was developed using the same antibody as in B. Positions of molecular mass markers (in kD) are shown to the left of the blots.

