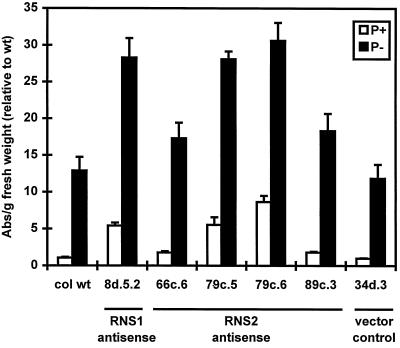
Figure 10.
Seedlings of RNS2 antisense lines grown as described for antisense RNS1 lines in Figure 6. Anthocyanins were extracted as described in Methods. Each bar represents at least six independent plates. Absorbance was measured and results were normalized as in Figure 8 (1 = 0.14 absorbance units per gram fresh weight). An RNS1 antisense line (8d.5.2) was included to facilitate comparison. col wt, Columbia wild type. Error bars correspond to ±se.

