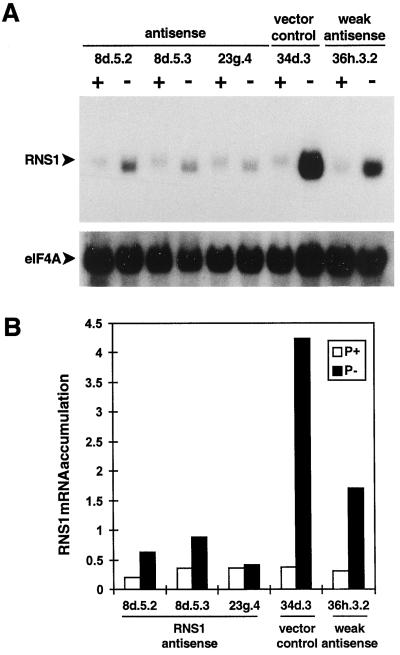
Figure 7.
Decreased RNS1 mRNA levels in RNS1 antisense lines. Seedlings of antisense RNS1 lines were grown as described in Figure 6, and total RNA was isolated from all kanamycin-resistant seedlings. A, RNA gel blots containing 10 μg of sample per lane were hybridized to an eIF4A probe and subsequently to the antisense RNS1 probe. Labels are the same as in Figure 6. B, RNS1 and eIF4A counts were quantitated with a phosphor imager, RNS1 counts were divided by eIF4A counts for each lane, and the results were plotted to represent RNS1 mRNA accumulation in each line.

