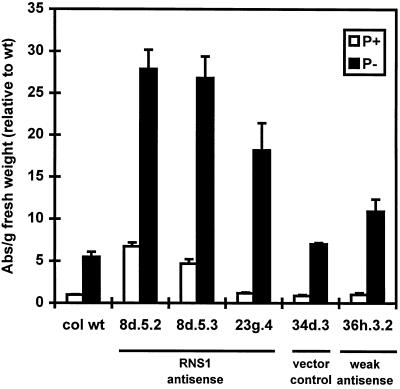
Figure 8.
Quantitation of anthocyanin levels in seedlings of RNS1 antisense lines. Seedlings of antisense RNS1 lines were grown as described in Figure 6, and anthocyanins were extracted as described in Methods. Each bar represents four independent plates. A530 minus A657 was taken as a measure of anthocyanin content, and for each sample the absorbance (Abs) reading was divided by the fresh weight of the sample in grams. The results were normalized using an arbitrary value of 1 for the wild-type line (col wt) grown on Pi-rich medium (1 = 0.14 absorbance units per gram fresh weight). Labels are the same as in Figure 6. Error bars correspond to ±se.

