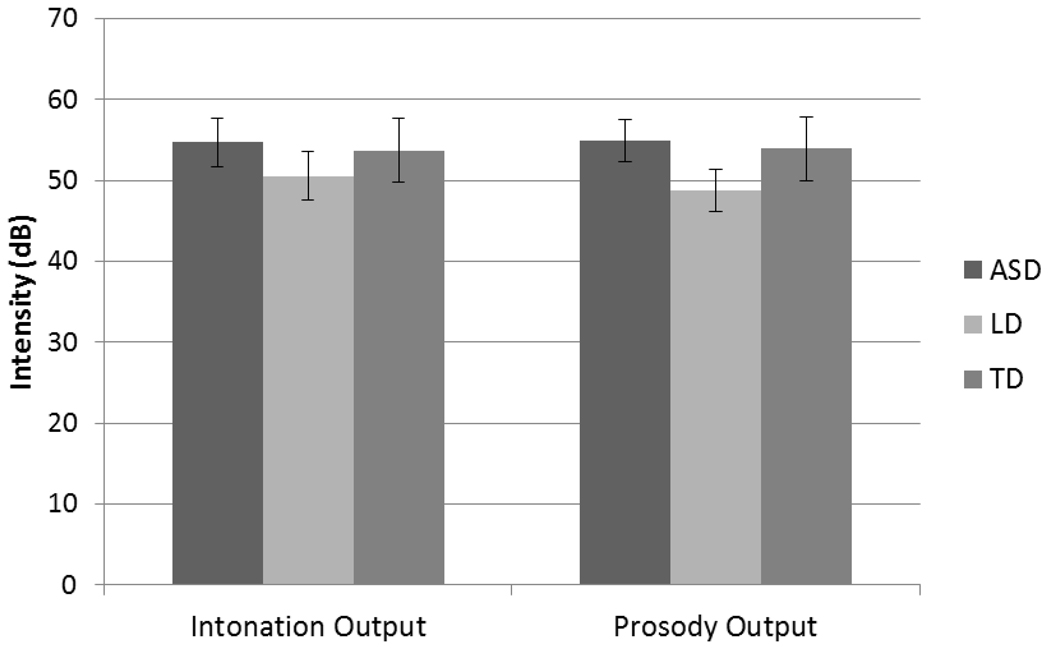
Figure 3. Average utterance intensity, organized by task, for each participant group.
Note: Statistical tests represent Omnibus ANOVA for each subtest, or the Welch’s test where statistically appropriate. Error bars represent standard error of the mean. PEPS-C = Profiling Elements of Prosodic Systems in Children (Peppé & McCann, 2003).

