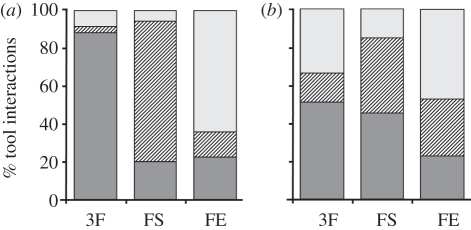
Figure 2.
Percentage of tool interactions with each of the available tools. Each histogram represents the interactions during the sessions with all tool types: functional (3F), functional spoon (FS) and functional egg-shaped tool (FE) for (a) M1 and (b) M2. Light grey bars, egg-shaped; striped bars, spoon; dark grey bars, stick.

