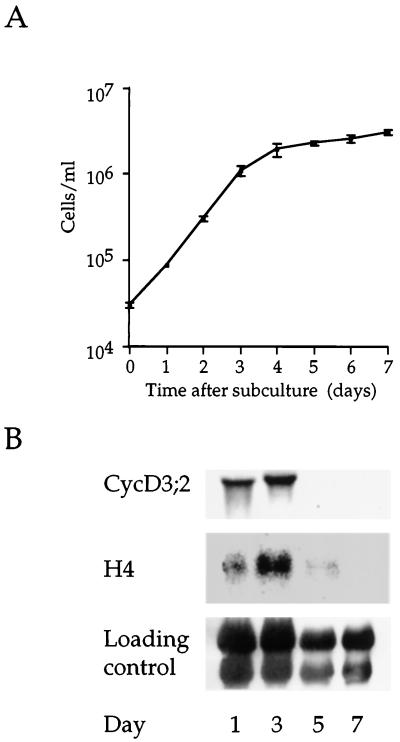
Figure 4.
Growth-phase-dependent expression of CycD3;2. A, Growth curve of tobacco BY-2 cells in batch-suspension culture. Stationary-phase cells (7 d after subculture) were subcultured into fresh medium and incubated for 7 d. The mean cell number was determined daily; the error bars represent the se determined from three samples. B, Total RNA isolated from samples taken at the indicated times was blotted and hybridized to the indicated cDNA probes. The loading control was by methylene blue staining of the membrane.

