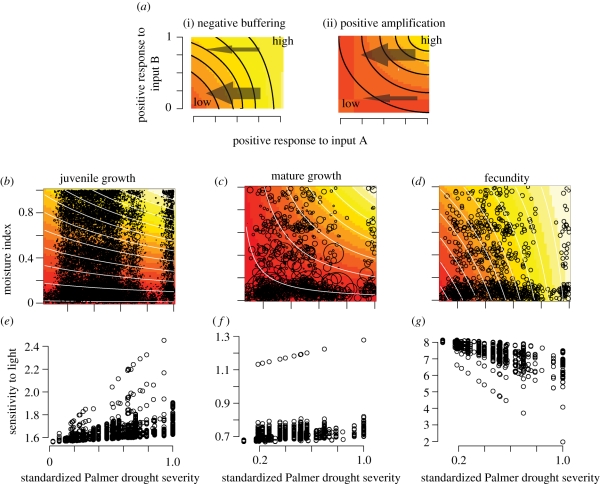
Figure 1.
(a) Examples of (i) negative and (ii) positive interactions when input variables are scaled to (0,1) (equation 2.10). Contours and shading indicate magnitude of the response. Strong interactions (thick arrows) cross many contours, weak interactions (thin arrows) cross few contours. Negative interactions indicate a large response to one input when the other is low, and vice versa. (b–d) Fraxinus interactions are positive for adult and juvenile growth and negative for fecundity. The distribution of data (size of circles proportional to magnitude of response) helps evaluate parameter space where observations are insufficient. (e–g) Sensitivity to light for Fraxinus depends on the summer drought experienced by each tree in each year (dots).

