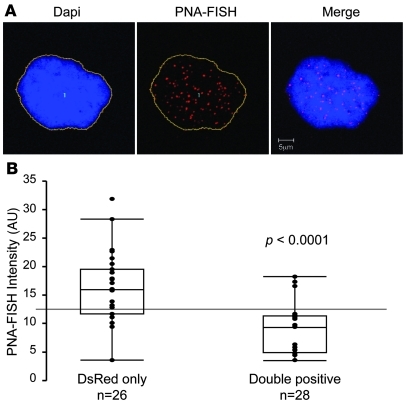
Figure 2. Progerin-expressing cells from normal individuals show signs of senescence.
(A) An example of the quantitative telomere PNA-FISH analysis of a normal fibroblast cell (HGFDFN168). DNA was stained with DAPI in blue to show the boundary of the nucleus (outlines), and telomere-FISH signals are in red. Scale bar: 5 μm. (B) Box plot representation of the absolute fluorescence intensity of the telomere-FISH in double-positive (n = 26) and DsRed-only (n = 28) cells. Each dot represents the absolute fluorescence intensity in 1 tested cell. Box denotes 25th and 75th percentiles; line within box denotes 50th percentile; whiskers denote 9th and 91st percentiles. P < 0.0001, double-positive vs. DsRed-only.

