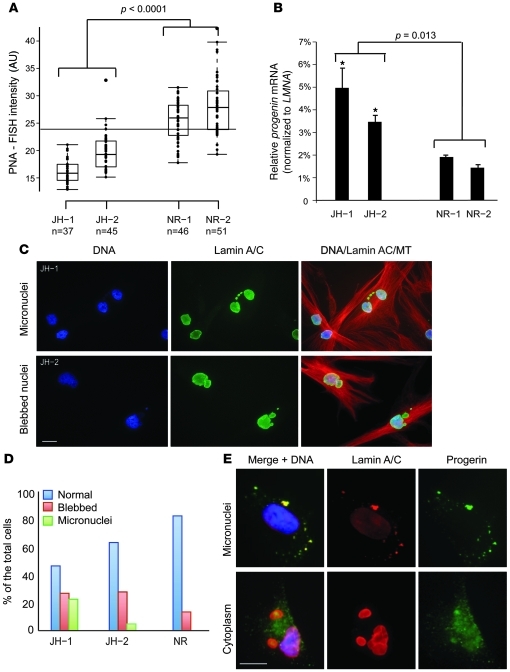
Figure 5. Progerin production is more abundant in passage-matched DC fibroblasts that carry a TERT mutation.
(A) Box plot representation of the quantitative telomere PNA-FISH in JH-1 and JH-2. JH-1 and JH-2 had significantly shorter telomeres compared with passage-matched normal fibroblast controls (P < 0.0001). All cell lines were analyzed at p12–p15. NR1 and NR2, normal fibroblast controls HGFDFN168 and HGFDFN090, respectively, at p14. n is indicated for each group. Box denotes 25th and 75th percentiles; line within box denotes 50th percentile; whiskers denote 9th and 91st percentiles. (B) qRT-PCR analysis of progerin mRNA in JH-1 and JH-2 cells. The relative expression values for progerin were normalized to the mean values of LMNA. Significantly greater amounts of progerin were observed in p12 JH-1 and p15 JH-2 cells, which have accelerated telomere shortening (P = 0.013, p12 JH-1 and p15 JH-2 vs. p14 NR-1 and p14 NR-2). (C) Immunofluorescence of JH-1 and JH-2 fibroblast cells with anti-lamin A/C antibody (green) and anti–α-tubulin (MT; red) antibody. DNA is labeled with DAPI in blue. (D) Quantification of nuclear blebbing and micronuclei in p12 JH-1 and p15 JH-2 cells. A normal fibroblast (NR; AG08470 at p14) was used as a control. (E) Immunostaining with anti-progerin antibody in selected DC cells. DNA is stained with DAPI in blue. Scale bar: 10 μm.

