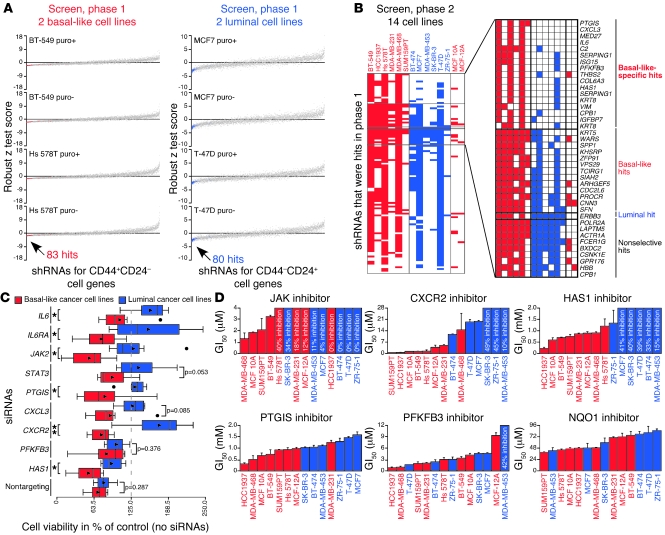
Figure 2. Identification and validation of genes required in basal-like breast cancer cells.
(A) Robust z test scores ([average viability – plate median average viability]/[plate median absolute deviation of average viability]) from shRNA screen, phase 1, for shRNAs with infection efficiencies greater than 0.25 and robust z test score SD below the 99th percentile for both basal-like and luminal cell lines with and without puromycin (puro). Data representing basal-like and luminal hits, selected based on their 4 basal-like or luminal robust z test scores as described in the text, are red and blue, respectively. (B) Scoring of shRNAs with infection efficiencies greater than 0.25 for all cell lines and classification of hits in shRNA screen, phase 2. Shading indicates shRNAs scored based on percentage of control values ([100 × average viability]/[median average viability of plate controls]). Genes corresponding to hits are listed. (C) Box plots showing viability of breast cell lines treated with siRNAs in triplicate for 3 days. Triangles mark averages. Circles mark outliers (which were included in P value calculations). *P < 0.05, t test; **P < 0.01, t test. (D) GI50 values for inhibitors in breast cell lines. The maximum percentage of growth inhibition observed is shown when cells were not affected enough for GI50 calculation. Error bars show SD of triplicates. All percentage growth inhibition data used to prepare these graphs are depicted in Supplemental Figure 2C.

