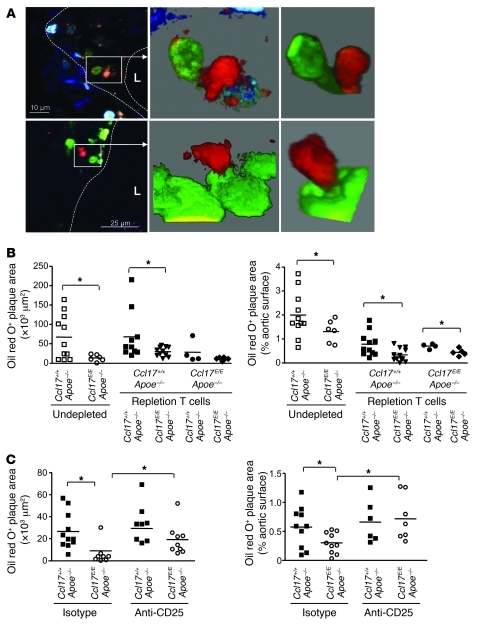
Figure 5. CCL17+ DCs mediate atherogenesis by priming T cells.
(A) Multiphoton microscopy was used to obtain 2D optical slices (left images) and 3D projections of matching zoomed areas (middle and right images) revealing EGFP+ DCs (green cytoplasmic staining) in close contact with DiI-labeled CD4+ T cells (red) in atherosclerotic vessel walls at the carotid artery bifurcation (upper panels, ×10 μm) and the aortic root (lower panels, ×25 μm) of Ccl17E/+Apoe–/– mice fed a high-fat diet. Dashed lines demarcate lesional area; L, lumen. (B) CD4+ T cells sorted from 6-month-old Ccl17+/+Apoe–/– and Ccl17E/EApoe–/– mice on normal chow were adoptively transferred into 8-week-old Ccl17+/+Apoe–/– and Ccl17E/EApoe–/– mice depleted of CD4+ cells. Undepleted Ccl17+/+Apoe–/– and Ccl17E/EApoe–/– mice served as controls. After 6 weeks of high-fat diet, atherosclerotic lesions were quantified in the aortic root and aorta after staining with oil red O. Individual data points represent average plaque area per mouse; horizontal bars denote mean. *P < 0.05. (C) Atherosclerotic lesions were quantified in aortas stained with oil red O in Ccl17+/+Apoe–/– and Ccl17E/EApoe–/– mice treated with depleting anti-CD25 antibody or isotype control and fed a high-fat diet for 4 weeks. Individual data points represent average plaque area per mouse; horizontal bars denote mean. *P < 0.05.

