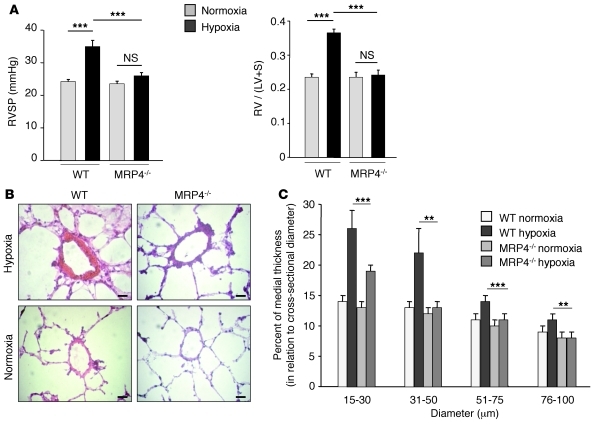
Figure 3. Prevention of hypoxia-induced PH in Mrp4–/– mice.
(A) RVSP (mmHg) and RV hypertrophy reflected by the RV weight over LV plus interventricular septum (S) weight ratio (RV/[LV + S] = Fulton index) in each group (n = 15, ***P < 0.001). (B) Representative H&E-stained sections of small pulmonary arteries from lungs of WT and Mrp4–/– mice in normoxia and hypoxia conditions. (C) Percentage of medial thickness of small arteries in relation to cross-sectional diameter (**P < 0.01). Scale bars: 20 μm.

