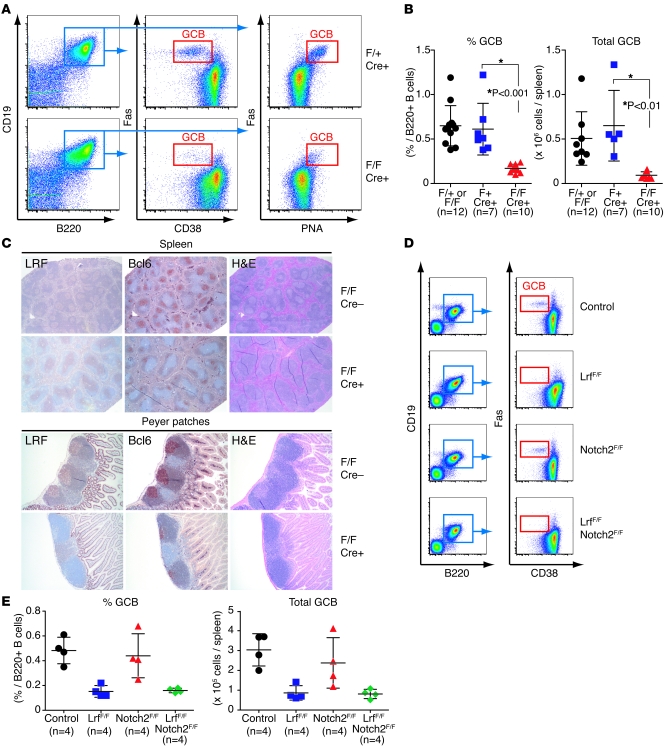
Figure 2. LRF is necessary for GC formation.
(A) FACS profiles of splenic GC cells. Control (LrfFlox/+ mb-1 Cre+) and KO (LrfFlox/Flox mb-1 Cre+) mice were intraperitoneally injected with NP-CGG. Splenocytes were harvested 2 weeks after immunization and analyzed with multi-color FACS using the indicated cell surface markers. (B) There were significantly fewer GC cells in LrfFlox/Flox mb-1 Cre+ mice. Dot graphs demonstrate proportions (left) and absolute numbers (right) of GC cells (DAPI–B220+CD19+CD38–FAS+) of each genotype. Cre-negative control (n = 12), Lrf heterozygous (Flox/+ Cre+; n = 7), and B cell–specific Lrf KO (Flox/Flox Cre+; n = 10) mice were analyzed. Horizontal black bars indicate average value; error bars indicate SD. (C) IHC analysis of secondary lymphoid organs. GC formation in Peyer patches (bottom) and spleens (top) was examined by IHC. GCs are recognized as clusters of Bcl6-positive cells. Original magnification, ×40 (spleen); ×100 (Peyer patches). (D) FACS profiles of splenic GCB cells for control, Lrf KO (LrfFlox/Flox mb-1 Cre+), Notch2 KO (Notch2Flox/Flox mb-1 Cre+), and Lrf/Notch2 double-KO (LrfFlox/FloxNotch2Flox/Flox mb-1 Cre+) mice. The reduction in GCB cells was not recovered by loss of the Notch2 gene. (E) Frequencies and absolute numbers of GCB cells for each genotype. Horizontal black bars indicate average value; error bars indicate SD.

