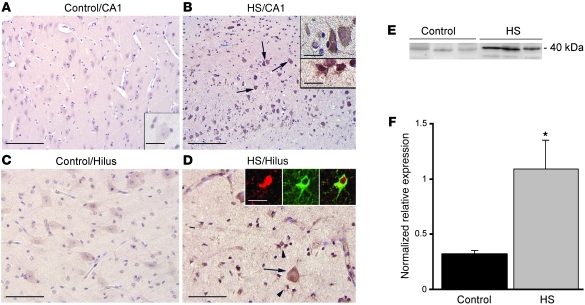
Figure 3. ADK immunoreactivity in hippocampus of control and TLE patients with medial temporal HS.
(A–D) Sections were counterstained with hematoxylin. Shown are representative CA1 (A and B) and hilus (C and D) from the same sample. (A and C) Control hippocampus showed weak ADK immunoreactivity. Histologically normal surgical hippocampus displayed an immunoreactivity pattern similar to that in control autopsy hippocampus (not shown). (B and D) The HS specimen demonstrated increased ADK expression in both residual pyramidal and hilar neurons (arrows and B, top inset) and in reactive astrocytes (arrowheads and B, bottom inset). Insets in D show expression of ADK (red) in a reactive astrocyte (GFAP, green). Scale bars: 160 μm (A and B); 80 μm (C and D); 40 μm (A, inset, and B, top inset); 15 μm (B, bottom inset, and D, insets). (E and F) Western blot analysis of ADK of total homogenates from control autopsy hippocampus and HS specimens. (E) Representative immunoblots. (F) Densitometric data, expressed relative to optical density of β-actin (n = 5 per group). Data are mean ± SEM. *P < 0.05 vs. control.

