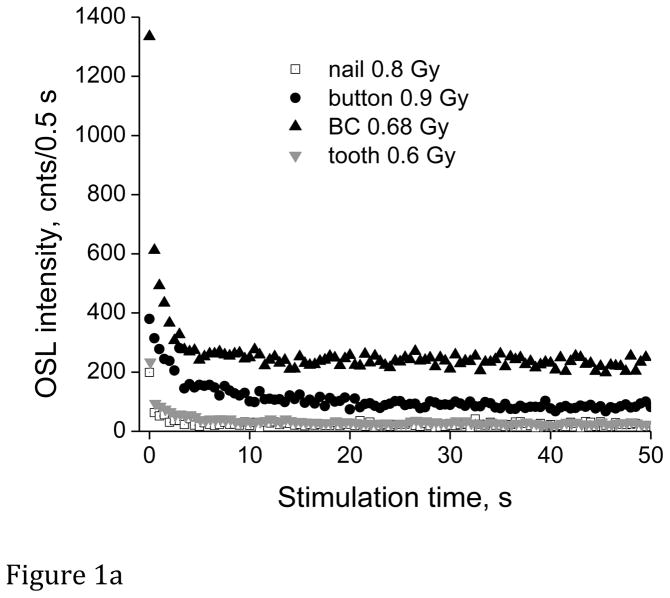
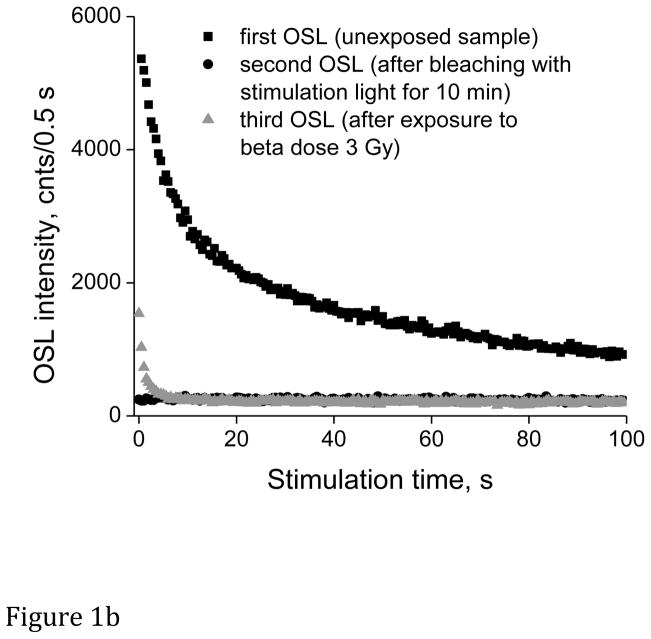
Figure 1.
Examples of OSL curves for teeth, nails, business cards (BC), and plastic buttons recorded immediately after samples exposure. a – OSL curves from samples without an inherent native signal (only OSL curves of exposed samples are shown for different materials because corresponding unexposed samples displayed no signal above flat noisy background); b – OSL curves from a business card sample with an initial native signal. Three different OSL curves are shown: the first is the OSL curve in an initial unexposed sample; the second is the OSL curve from the same sample but following bleaching by stimulation light for 10 min; the third is the OSL from the same sample after bleaching and exposure to a beta-dose of 3 Gy.


