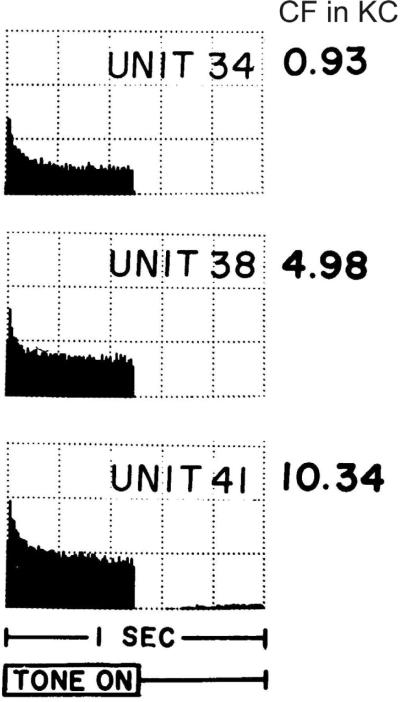
Fig. 1.
Post-stimulus time histograms from three units with low to high characteristic frequencies (CF) showed similar response patterns to tone bursts. Recordings were made from cat auditory nerve fibers. Each histogram averages 2 minutes of data. Y-scale: 200 spikes/per increment. Burst levels used: −50 dB for unit 38; −70 dB for unit 34 and 41. Adapted from Kiang et al., 1965

